The Volume Weighted Average Price (VWAP) is a term used for both a strategy and a benchmark. The benchmark came about to measure the performance of the strategy, and the strategy became popular following decimalization in the equity markets that led to less pre-trade liquidity in the order books resulting in the need for large orders to interact stealthily with the market. These VWAP orders were executed by slicing and dicing themselves up into smaller pieces and executing over a longer time horizon so they could "blend in" with other volume and trade in roughly the same proportions as the market.
As transaction cost analysis developed, the VWAP became a go-to benchmark because a lot of people were using VWAP strategies. But the VWAP isn’t a cost benchmark, instead it is a performance benchmark. What does that mean? Performance benchmarks measure adherence to a strategy, but not necessarily the price impact. The VWAP compares an average price for an order with the average price available in the market, based on executed volume. So a large order trading a stock that is rising through the day because of its market impact may well match or outperform the VWAP, but still result in a large amount of alpha slippage. A cost benchmark, such as arrival price which is set prior to implementing an order will provide a much better measure of transaction costs.
If you are using a VWAP strategy, then it makes sense to measure your average price versus a VWAP benchmark so you can tell whether you (or your broker) executed the strategy well, but that doesn’t preclude using a cost benchmark to gain another perspective, i.e. the market impact. Whether or not a VWAP strategy is a good idea is another question that will not be addressed here. Instead, let’s look at some of the properties of using the VWAP benchmark in TCA that may not be obvious.
It is easy to see how the VWAP benchmark can fail miserably at measuring market impact
The first thing to note is that size matters. If your order is all that trades on the day, then by definition, the average price of your order will be exactly equal to the benchmark. At this extreme, it is easy to see how the VWAP benchmark can fail miserably at measuring market impact - if you push the market higher with a large buy order, but were the only one buying, you will have market impact. You will look good versus VWAP, but bad versus arrival price.
What about at the other extreme? If you have a very small order then you should have a small market impact and very little influence on the VWAP. Any deviations versus a cost benchmark are mostly likely the result of market volatility rather than market impact from the order.
Today, most TCA products will report VWAP performance in either dollars or basis points, but neither of these approaches factors in the relative size of the order.
Today, most TCA products will report VWAP performance in either dollars or basis points, but neither of these approaches factors in the relative size of the order. The questions that arise are: Can we do better? Is there some way we can improve on the way we report performance versus a VWAP benchmark?
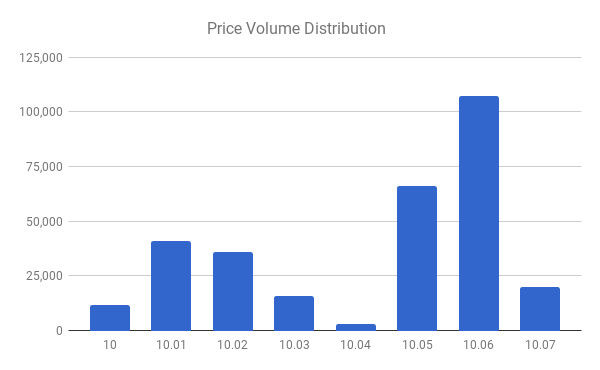
Consider a price volume distribution as shown in Figure 1. Here the volume at each discrete price that traded during the period that an order was being worked in the market is shown. We can compute the market VWAP in the standard way from this data to get our benchmark. The question we want to try to answer here is: How does our order’s performance compare with the benchmark? It is an easy procedure to compute the average price of our order and then we can compare, but we still haven’t factored in the size of our order relative to the market. How can we do that?

Figure 1 shows a hypothetical price-volume distribution for a stock trading in the range $10.00 - $10.07. The market VWAP here is $10.0428.
We can interpret Figure 1 as being the opportunity set available to our order. Let’s say for the sake of example that our order is small and consists of 10,000 shares versus transacted market volume in the same period of 300,000. The lowest price we could have achieved from this opportunity set would have been $10.00 - i.e. all of our volume done at the lowest price, while the highest price would have been $10.07. As our hypothetical order gets larger, then we would have to exhaust the volume at 10.00 and then transact some volume at 10.01 in order to achieve the lowest possible price, and similarly for the highest price. For example, given the price volume distribution from Figure 1, a 20,000 share order would have the lowest price of 10.0042 and a highest price of 10.6985. As our order size grows, we will need to execute volume at more and more price points.

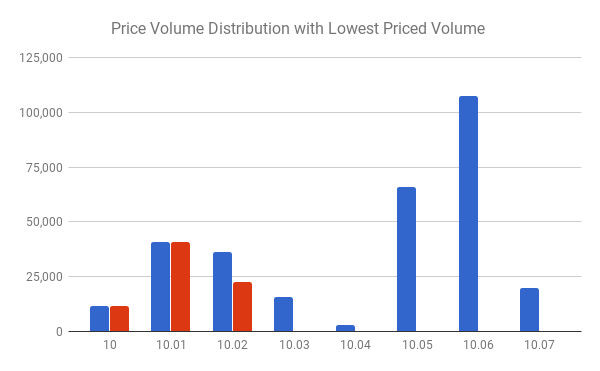
Figure 2 shows the lowest priced volume in red. The red volume sums to the order volume, in this case 75,000 shares while the blue shows the market volume, here 300,000 shares. The red volume can be used to compute the lowest possible average price an order of 75,000 shares could have achieved given the blue market volume. The VWAP of the red price-volume distribution is $10.0115.
For a given order size, we can then compute not only the order’s volume weighted average price, but also the lowest possible average price attainable given a market volume distribution, see Figure 2. We can also compute the highest priced average price. As our relative size approaches 100% of the market volume, the range between the lowest average price and the highest average price will shrink, as we would expect as our order "becomes the VWAP" - we must match the VWAP when we are all of the volume! This approach will factor in our relative size allowing us to get a better understanding of our performance. In particular we can normalize the absolute difference between the market VWAP and the order’s average price by dividing by the difference of the highest possible average price (for the size of our order) and the lowest possible average price.
The approach presented here takes into account the distributional characteristics of the price-volume distribution that was available to us as we worked our order. This will allow a better assessment of how well we made use of the opportunity set available in the market and in addition allow a better way to aggregate across various orders that were executed in market conditions that had different price-volume distributions. It will also allow us to better compare orders with different relative volumes.
Photo from National Post , July 18, 2017
Comments